
The Quick Market Overview
Jefferson County housing, Sept. 1, 2025 through Sept. 1, 2026. All numbers are year over year. Data pulled 9/1/2026. By Brett Kennedy, LREI / United Real Estate Louisville.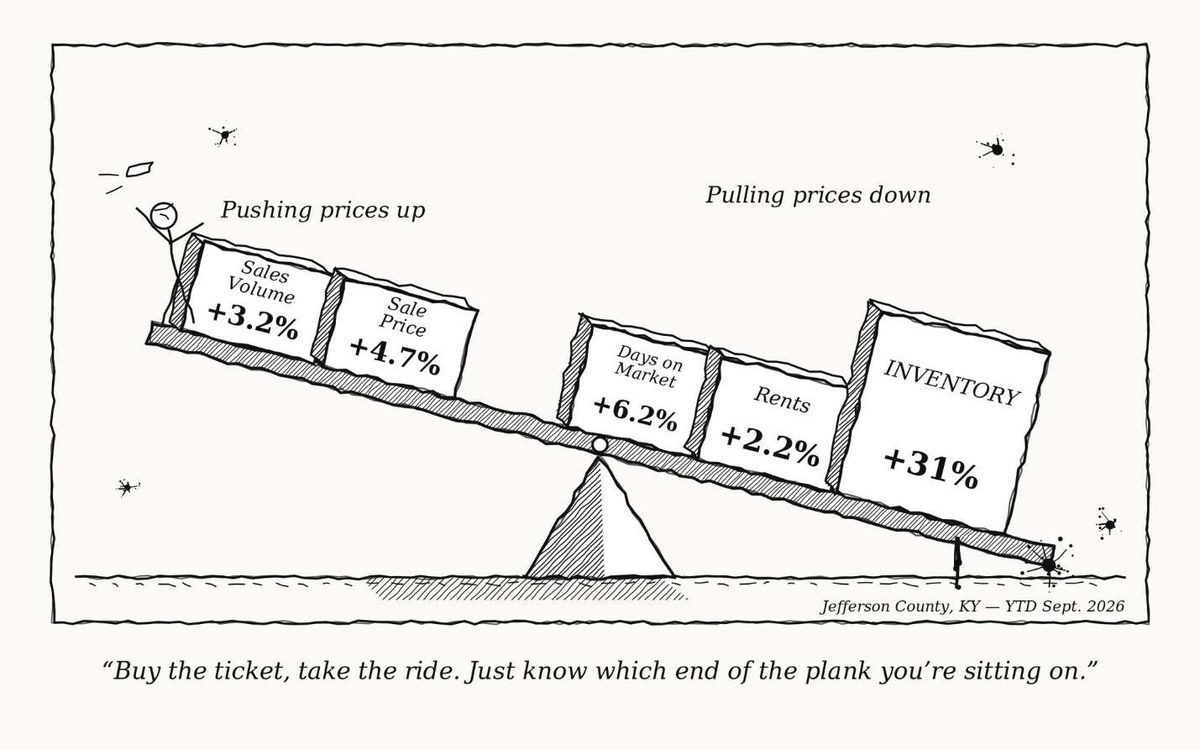
Louisville’s market direction is changing. Interest rates are about double where they were just four years ago and that comes with consequences.
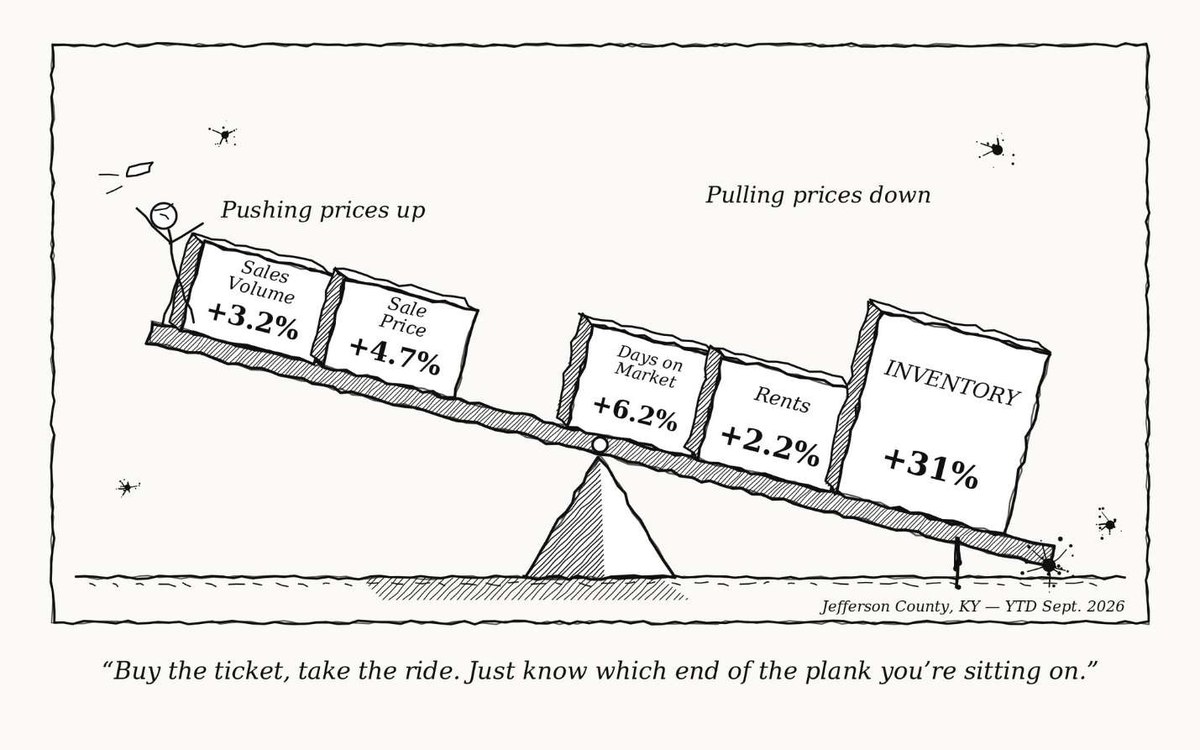
The positives: Prices are up 4.7% and sales volume is up 3.2%. In regards to appreciation, historically that’s a strong number for Louisville. Prior to 2020, appreciation rates in Louisville rarely exceeded 5%.
The negatives: Days on market is up 6.2%. Houses are sitting longer. Sitting houses are houses that get negotiated. Rents crept up just 2.2%. And then there’s the big crate on the far end of the seesaw: inventory is up 31%. That is a harbinger of a market change. I suppose I could have thrown an interest rate crate on the right side too… oh, and cash purchases declined 4.8% since last year too.
So the plank is tilting. The market isn’t featureless. It has texture and curves, and in some areas it is showing signs of stress and in other areas it’s still clearly a seller’s market… for the moment.
Two Market Observations
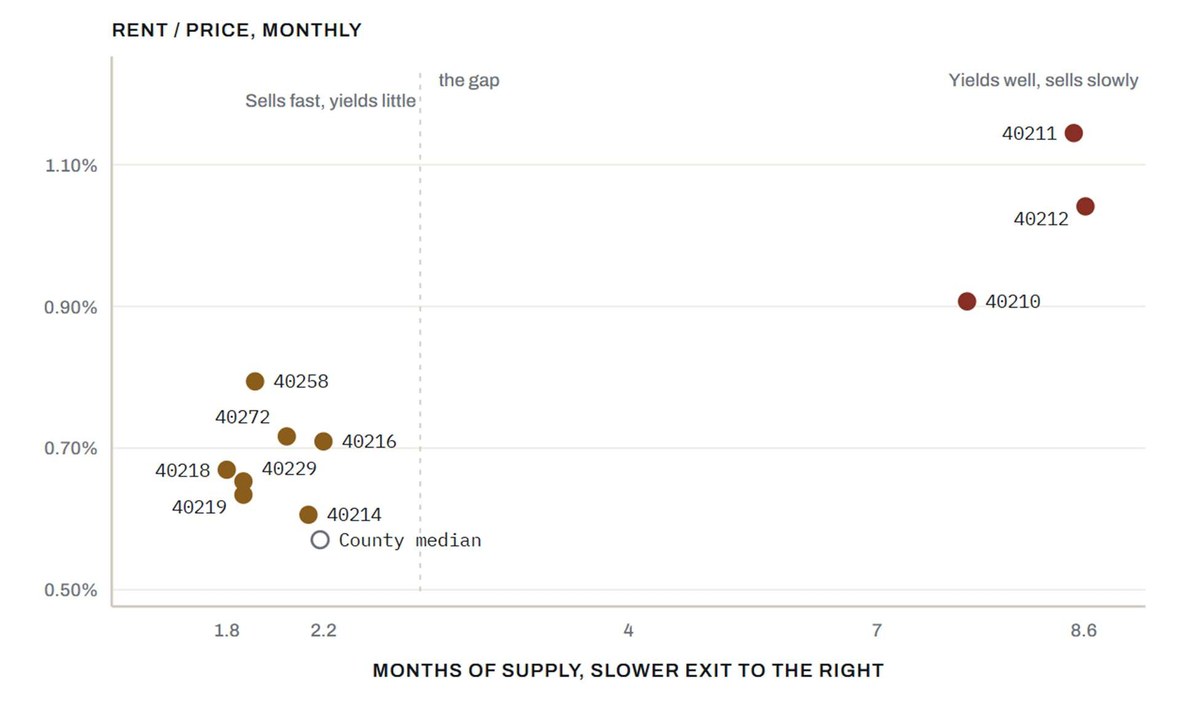
West Louisville offers the yield. It does not offer the exit.
40203, 40210, 40211 and 40212 are the only zip codes I see clearing a 1% rent-to-price ratio — but they carry more than 8 months of supply against 1.8–2.2 months everywhere else, sell at 89% of original list, and average 48 days on market.
The South End is where the volume and the velocity are.
40214, 40216, 40272 and 40229 each closed 300-plus sales through July, moving in under 2.2 months of supply at 97–99% of original list. It’s thinner margins, but a predictable exit which is what a flipper wants to buy.
The Whole County, Ranked for Liquidity
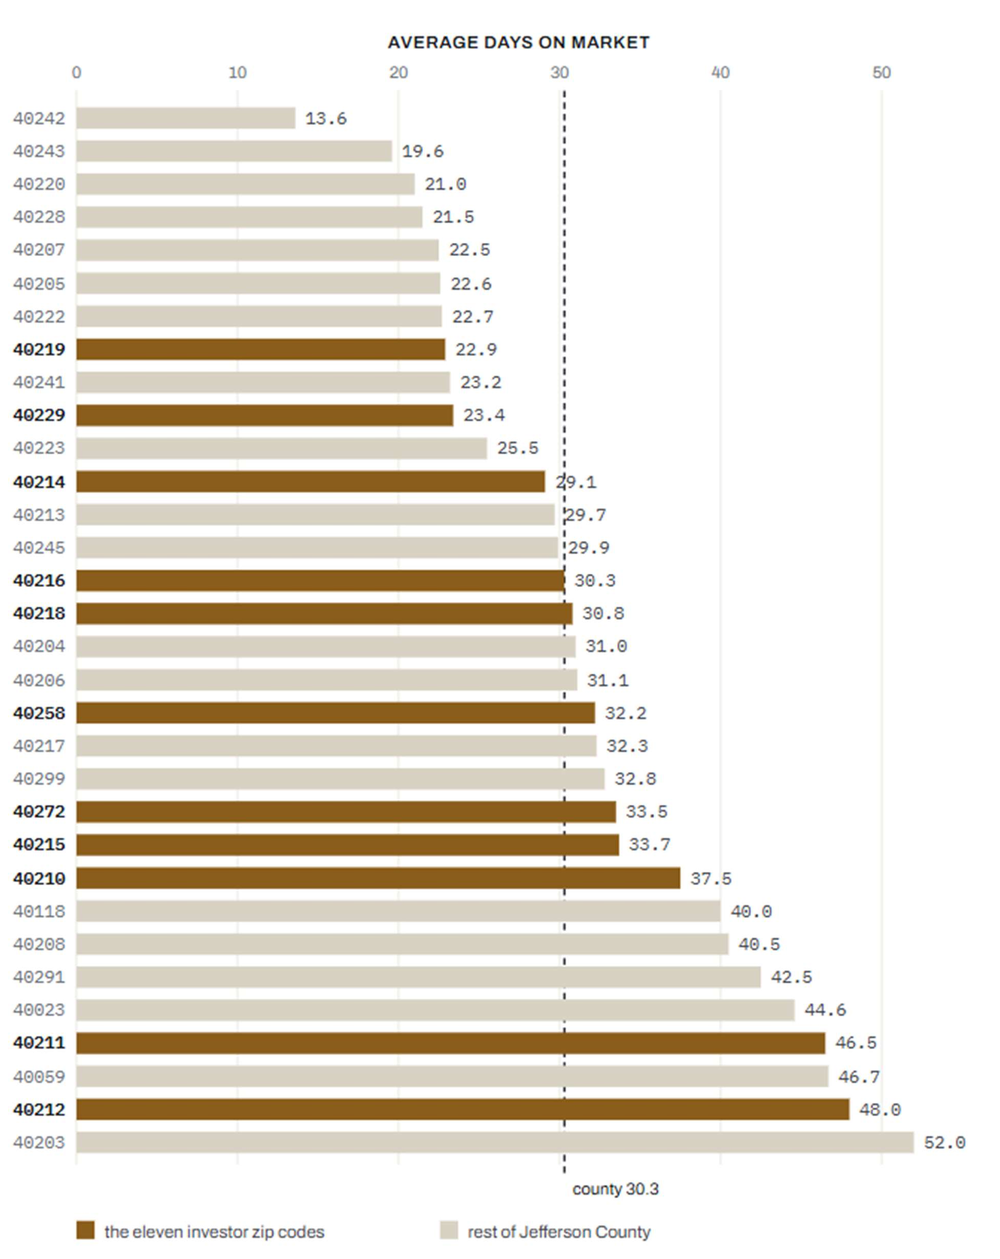
Here is days on market for every residential zip code in Jefferson County, averaged over the last six months through August 2026. The current average days on market sits at 30.3 days. I’ve highlighted the eleven zip codes from the chart above. They run from 22.9 days in 40219 to 48.0 days in 40212.
What’s Old Is New Again
Screening rules change with the times. They are fashion for the real estate investor, a sign of the times. The 2% rule is go-go boots and short skirts. It gave way to the longer hem-lined 1% rule, and now the 1% rule is on its way out.
Prices have climbed faster than rents, and rates have roughly doubled from where they sat a few years ago. Most properties in decent neighborhoods now come in at 0.6% to 0.8%, and the few that hit 1% or better come with a reason.
So new times, new tools, and why the 1% rule, which is completely practical and something suitable to bring home to meet the parents, is being replaced by the Rent-to-Payment Ratio for every day wear.
The formula for the Rent-to-Payment Ratio is straightforward. It is the estimated (or actual) monthly rent divided by the monthly PITI (principal, interest, taxes, and insurance).

If this looks familiar, it should. It’s DSCR, the same ratio lenders have used to underwrite commercial and investment loans for decades. What’s changed is that it’s now fashion for the investor, not just the bank.
As a quick rule of thumb: at 1.25 or better, the property covers its debt with room for vacancy, repairs, and management. Between 1.0 and 1.25, it’s tight, and you’d better know your numbers cold. Below 1.0, you’re feeding the property every month. That’s negative cash flow, and it won’t get better soon.
The ratio can be used to do stress testing too. Trim the rent on top to reflect a realistic vacancy rate. Push the payment on the bottom to account for a tax reassessment or an adjustable rate that’s about to adjust. Run it a few different ways and see where the number lands.