
The Two Louisvilles
What 859 Leases, Rising Mortgage Defaults, and a 7.7% Loss Rate Tell Investors
By Clay Smith, LREI Property Management
There are two Louisvilles, and the rent checks know the difference.
In one of them — the East End, the suburbs, the eastern ZIP codes — tenants pay, on time, and a landlord's biggest worry is a furnace. In the other — the West End, the Southwest corridor, the southern edge — rent has become one more bill in a monthly triage, paid when the paycheck lands, if it lands. We manage property in both. This month we pulled the data to measure exactly how far apart they've drifted, and to put a real number on what that means for anyone underwriting a deal in this city. What we found is a local symptom of a national condition — and a warning that the gap is widening.
The macro story: a household squeeze that's broadening
Start with the backdrop, because the local numbers don't make sense without it. Across the country, the financial cushion that lower- and middle-income households built during the pandemic is gone, and the strain is now showing up in every category of consumer credit at once.
Mortgages are slipping, and FHA loans are slipping fastest. The Mortgage Bankers Association reported overall mortgage delinquency at 4.26% at the end of 2025, up 28 basis points year over year — but FHA delinquency hit 11.52%, its highest level since 2021, and rose another 126 basis points year over year in Q1 2026. The MBA tied it directly to the expiration of pandemic-era relief and a softening labor market — the two forces that hit lower-income borrowers first.
Autos and credit cards confirm it. The New York Fed's serious auto-loan delinquency rate reached 5.2% — the highest since 2010. Credit-card serious delinquency in the lowest-income ZIP codes has pushed past 20%. This isn't a housing story; it's a household-cash-flow story.
And Kentucky is the epicenter. On a 12-month basis, Kentucky posted the sharpest deterioration in mortgage delinquency of any state in the country — up 18.27% — ahead of Indiana and Ohio. Nationally, active foreclosure inventory is up roughly 32% year over year.
The common cause is the same one our tenants describe: inflation in the non-negotiables — insurance, utilities, taxes — colliding with flat wages at the bottom of the market.
The structural backdrop: why it's the West End
None of this fell on Louisville's map at random. West Louisville's vulnerability is engineered, and the irony is sharp: the Federal Housing Administration — the same FHA whose loans are now defaulting fastest — is the agency that redlined these neighborhoods generations ago, starving them of mortgage capital and triggering the disinvestment, business flight, and wealth gap that persist today. The east-west divide in income, rents, homeownership, and evictions is the direct descendant of that policy.
The eviction data makes the divide concrete. Jefferson County has averaged nearly 12,000 eviction filings per year since 2022, with about 26% ending in a judgment — and filings cluster in the western and southern ZIP codes, precisely the lower-income, higher-cost-burdened neighborhoods. With roughly 58,000 Louisville families living below the poverty line, the rent ledger was always going to be the first place the macro squeeze showed up.
The micro story: what 859 leases actually show
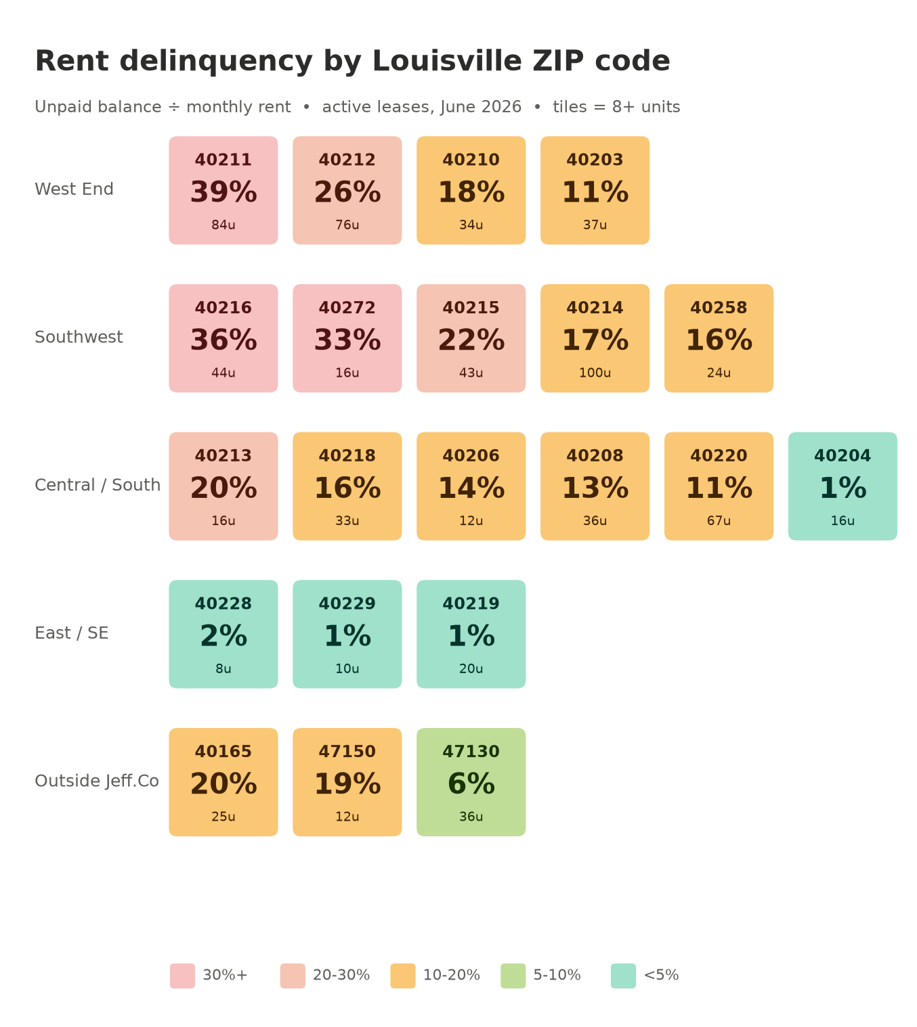
We analyzed 859 active Louisville leases — roughly $1M in monthly rent — and mapped the delinquency. Three findings matter.
1. Collection is a geography game — a 10x spread.
| Area | Representative ZIPs | Past-due (% of rent) |
|---|---|---|
| West End | 40211, 40212 | 26-39% |
| Southwest | 40216, 40272, 40215 | 22-36% |
| Central / South | 40208, 40218, 40220 | 11-16% |
| East End & suburbs | 40204, 40219, 40229 | under 3% |
Same city, same month, same management, same lease — a ten-fold difference in whether the rent arrives, driven by the household economics of the block.
2. Late is starting to turn into lost.
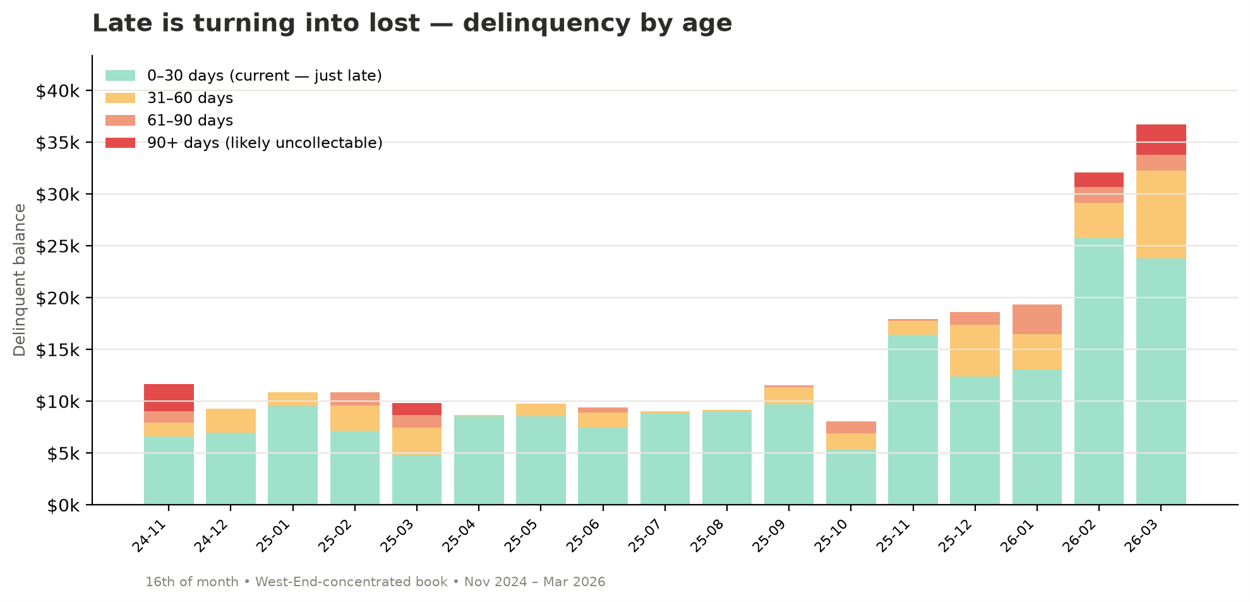
This is the finding that should get an investor's attention. We aged the past-due balances by how late they were, every month. Through all of 2025, the overwhelming majority — routinely 90%+ — sat in the 0-30 day bucket. That's not non-payment; that's timing — rent on the 18th instead of the 1st. Among our current tenants, only about 2% of billings ultimately go uncollected.
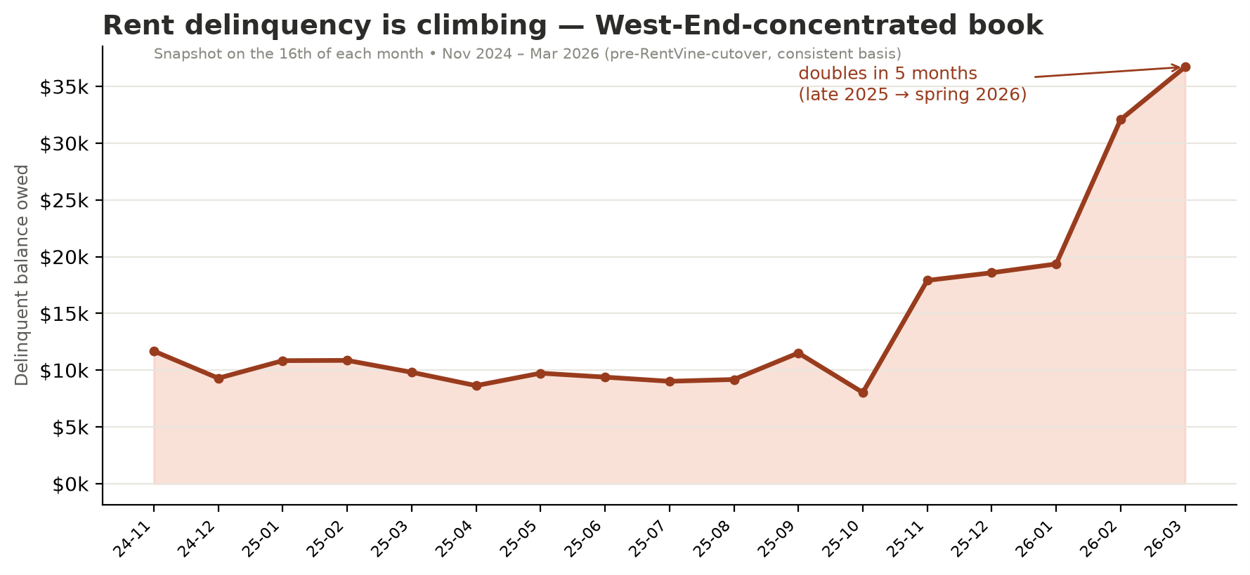
But in 2026 the balance stopped being all "current." Delinquent balances more than doubled from late 2025 into spring, and the older buckets began filling in. By March 2026, roughly 35% of the past-due balance had aged beyond the current month, with 8% sitting at 90+ days — a bucket that a year earlier was essentially empty. The timing problem is converting into a loss problem in real time.
3. The eviction pipeline confirms the direction.
Right now, 28 of the leases we manage are in active eviction and another 37 are on formal notice — concentrated in the same West End and Southwest ZIP codes, and mirroring the county's western-and-southern filing pattern.
A word on vouchers — they don't de-risk the tenant
Conventional wisdom says Section 8 is "guaranteed rent." Half true. The housing-authority portion — about $393K a month across 169 voucher leases in our book — is reliable. But the tenant's share is where the risk lives, and it underperformed: voucher serious (60+ day) delinquency ran 8.1% of contract rent versus 3.1% for market-rate. Even comparing voucher to market-rate units inside the same West End ZIPs, voucher delinquency was higher (37% vs 28%). The subsidy reduces your exposure; it does not eliminate the tenant-credit risk.
The number that matters: what you'll actually never collect
Most investors put a lazy 3-5% on the "credit loss" line of a proforma. The 30%+ snapshot scares them off good deals; the 4% rule-of-thumb lulls them into bad ones. Neither is the number you want. The number you want is realized credit loss — over a complete tenancy, of every dollar billed, how much never came in.
So we measured it on tenancies that have already ended. Across 182 completed (moved-out) tenancies in a West-End-concentrated book — real start-to-finish outcomes, including write-offs, after active collections:
7.7% of everything billed was never collected.
That is the honest uncollectable-rent reserve for these submarkets — far from both the 30% scare and the 4% default. In the East End and suburbs, realized loss runs closer to 1-2%.
| Submarket | Past-due (workload) | Credit-loss reserve |
|---|---|---|
| West End / Southwest | 25-39% | 6-8% |
| Mixed / central | 11-20% | 3-5% |
| East End / suburbs | under 3% | 1-2% |
What this means for investors
Reserve for the realized loss; staff for the snapshot. The 30% past-due figure isn't your loss — it's your collections workload. The 7.7% is what hits the bottom line if that workload gets done.
Watch the 90+ bucket, not the headline. Most of the balance is timing. The 90+ slice — near zero a year ago, 8% now — is your leading indicator of next year's write-offs.
The 7.7% is the managed outcome. It's what's left after deposits, payment plans, structured notices, and a disciplined legal process recover the rest. In a market where Kentucky leads the nation in mortgage-delinquency acceleration and the West End carries the structural weight of a century of disinvestment, a self-managing owner or a hands-off manager doesn't lose 7.7% — they lose multiples of it, because every "late" they don't work ages into a "never."
Diversify the concentration risk. With FHA defaults and foreclosure inventory climbing in these same neighborhoods, expect more distressed inventory and tighter buyer financing exactly where collections are worst.
Bottom line: Louisville is splitting into two markets, and the rent roll is the clearest seismograph we have. Where you own now predicts whether you get paid far more than what you charge — and the macro data says the pressure isn't letting up. Put a real, submarket-specific number in your proforma, and put real management behind it. The reserve protects you on the spreadsheet; the collections discipline protects you in the bank account.
Thinking about a Louisville rental — or watching collections get away from you on one you own? Call Stephanie Ann Smith at (502) 434-5420 or email stephanieann@lreillc.com. We'll walk through how to underwrite and manage it for the market it's actually in.
Compliance note: this is portfolio risk analysis, not a tenanting strategy. Screening, advertising, and leasing must comply with the Fair Housing Act and any applicable Louisville Metro source-of-income provisions. Use submarket data to price and reserve — never to steer or unlawfully exclude protected classes or voucher holders.
Sources
• Cotality — state delinquency (KY #1)
• ATTOM — foreclosure rates by state
• NY Fed — Household Debt & Credit
• TransUnion — 2026 credit outlook
• CFPB — rental housing delinquencies
• Louisville Housing Needs Assessment
.jpg)